Комментарии:

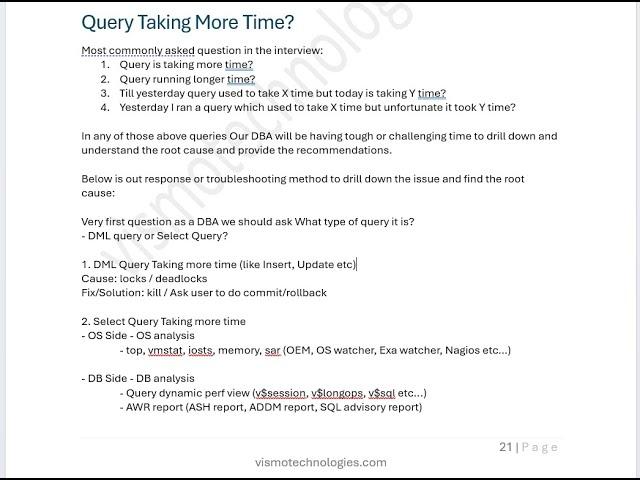
if query getting taking longer than usual, before going to OS Analysis, i always check below items:
1. get the sql_id of the query (v$sql)
2. compare the current sql_id with the previous one when running normally (dba_hist_sqlstat)
3. check the execution plan (select dbms_xplan.display_cursor) is there are any Full Table Scan operation, Index skip Scan, etc (check the index)
4. check if there's any changes of Plan Hash Value, this happens a lot. PHV Changes can caused by stale statistic table and so on.
5. check the wait event, the type of wait event can help to find the root cause.
ex: if the wait event show "enq:TX Row Lock Contention" you have to check if there are any blocker.
but if wait event show "row cache lock" with the "INSERT" operation, and the query using sequence, mostly caused by cache size 0
etc..


