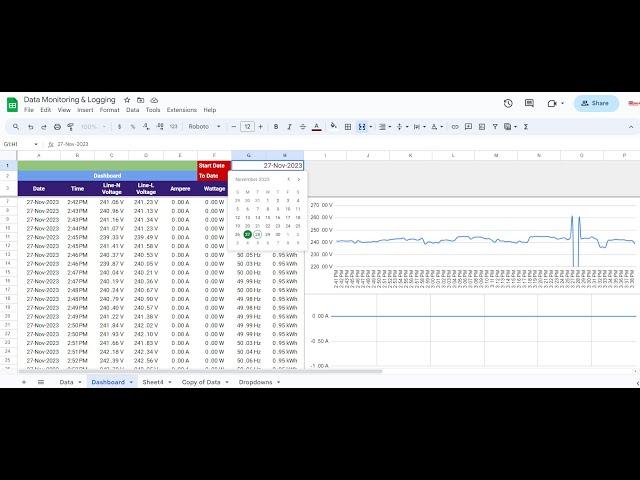
Creating a Google Sheets Dashboard with a Date Range Filter
Welcome to our channel! In this tutorial, we'll guide you through the process of creating a dynamic dashboard in Google Sheets that includes a date range filter. This powerful feature allows you to analyze your data over specific periods, making it easier to derive insights and make data-driven decisions.
🔍 What You'll Learn:
Setting up your Google Sheets dashboard
Adding a date range filter using Data Validation
Using formulas to filter data based on the selected date range
Creating charts and graphs that dynamically update with the date range
Tips for enhancing your dashboard
📋 Chapters:
0:00 Introduction
1:30 Setting Up Your Google Sheets Dashboard
3:00 Adding Date Range Filters
5:30 Using Formulas to Filter Data
9:00 Creating Dynamic Charts and Graphs
12:30 Enhancing Your Dashboard
15:00 Conclusion
🔧 Tools & Resources Needed:
Google Sheets account
Sample data set
Basic understanding of Google Sheets functions and formulas
📈 Why Watch?
Creating a dynamic dashboard with a date range filter in Google Sheets allows you to visualize your data more effectively and make informed decisions. This tutorial provides step-by-step instructions to help you create a professional and interactive dashboard.
👍 Don't Forget to Like, Subscribe, and Hit the Bell Icon to stay updated with our latest tutorials on data analysis, Google Sheets tips, and more!
🌐 Join the Community:
Have questions or need further assistance? Drop a comment below or join our community forum for in-depth discussions and support.
📞 Contact Us:
For professional services or consultation, visit our website or contact our support team.
Thanks for watching, and let’s get started with creating your Google Sheets dashboard with a date range filter!
Комментарии:
Creating a Google Sheets Dashboard with a Date Range Filter
Inovia Automation
On the Agenda: Asylum seekers, food aid, organised crime
European Parliament
Перехитрил своего соперника! #мма
Artem Tarasov MMA
Maybe Tomorrow Vlad & Tanya
Vlad Pankrat
Ball Factory Indoor Play & Cafe
Engel Family
Make a Simple Bending Tool
Andrian Metal stamping art
Klassi Ghalina Season 1 Episode 2 [FULL] (Good Quality 1080p)
KlassiGhalinaFans


![Klassi Ghalina Season 1 Episode 2 [FULL] (Good Quality 1080p) Klassi Ghalina Season 1 Episode 2 [FULL] (Good Quality 1080p)](https://smotrel.cc/img/upload/WS1kWEItWGNtV2E.jpg)


