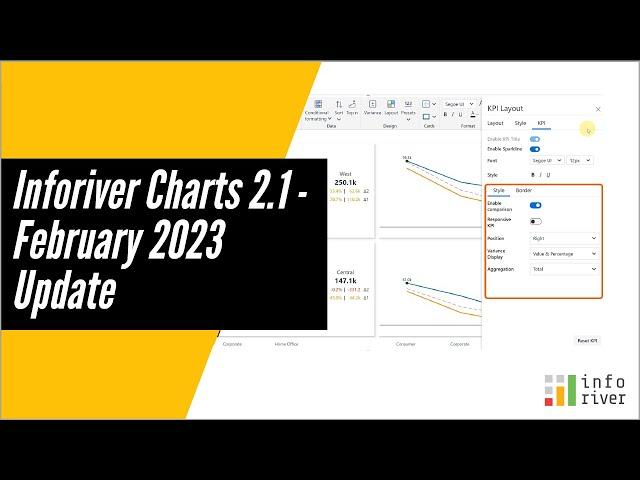
Inforiver Charts 2.1 - February 2023 Update
Inforive Charts 2.1 - Experience new visualizations like Executive Funnel chart, Stacked and stacked breakdown waterfall, slopegraph along with exciting features such as comparison bands on bar charts, enhanced storytelling using KPI Formula bar and lot more. Your #financialanalysis , breakdown analysis, sales analysis, and other advanced analysis in Power BI could all benefit from these new features.
It is available in Microsoft AppSource with the new developer-only licensing model with unlimited number of viewers.
Inforiver brings advanced #powerbi visuals, #analytics , financial and #varianceanalysis , and a #nocode experience to Power BI for a seamless dashboard building experience. Get a 360-degree view of performance across multiple time periods and categories with automated variances, trend lines, and reference bands. Leverage features requested in Power BI idea place and community forums. Inforiver also enables easier comparison with external industry benchmarks. Automate your processes with formula engine & calculations, manual data entry, #forecasting , writeback, audit trail, commenting & collaboration. Inforiver delivers unique capabilities available in other BI & visualization software (such as Tableau, Spotfire, Qlik, Cognos and SAP BusinessObjects) but not in Power BI, so that organizations can successfully migrate and consolidate their BI assets with Power BI.
Try it out right now for free here -- https://inforiver.com/charts/trial/
To receive regular updates visit:
Website: https://inforiver.com/
LinkedIn: https://www.linkedin.com/company/info-river/
Twitter: https://twitter.com/inforiverbi
Facebook:https://www.facebook.com/inforiveranalytics/
Community : https://community.inforiver.com/
Комментарии:
How to properly start a shifter kart
mark8driver
KZ vs Honda Shifter Engines movie
Begin Again
Глазурь для куличей
🏠 Дом Рустаевых.
LEATHERMAN WAVE PLUS опыт использования
Juri Aljnaki
KAZAKHSTAN STARS Танец "Эй, малявка" д/с №104 г.Павлодар
Ксения Бутенко
Kırlangıç Fırtınası | Halil Ergün Perihan Savaş Eski Türk Filmi Full İzle
Fanatik Klasik Film


